Activity-Stream-Graph
The Activity-Stream-Graph project, developed by Webosmotic for a healthcare client, focuses on creating a specialized D3.js library-based chart. Tailored to the healthcare domain, it enables intuitive visualization of doctors' interactions with patients, offering insightful reports. Challenges included designing a clear timeline representation and implementing seamless user interaction. The project successfully delivered a functional timeline visualization, complete with interactive controls, addressing healthcare industry requirements.
Industry
Healthcare
Country
Sri Lanka
Project Summary
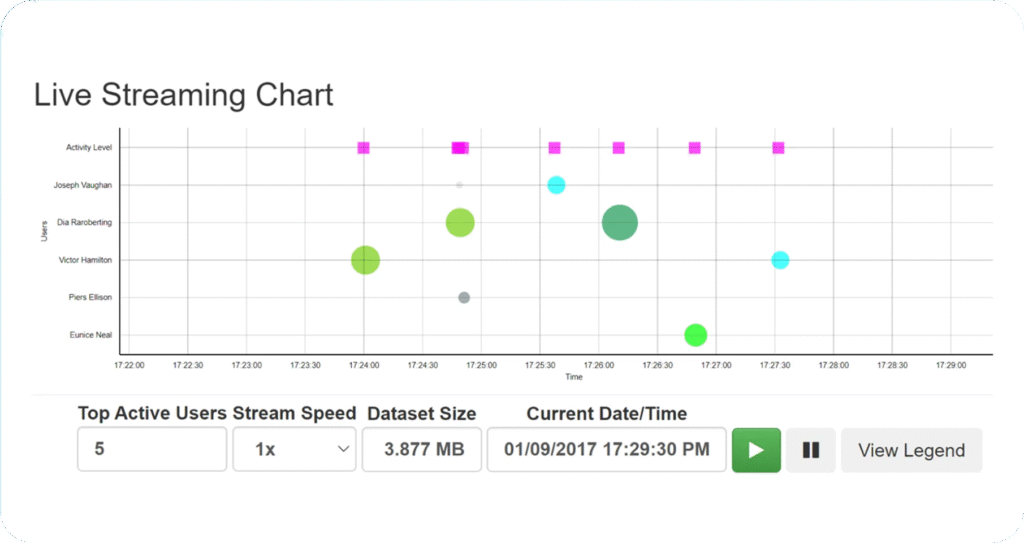
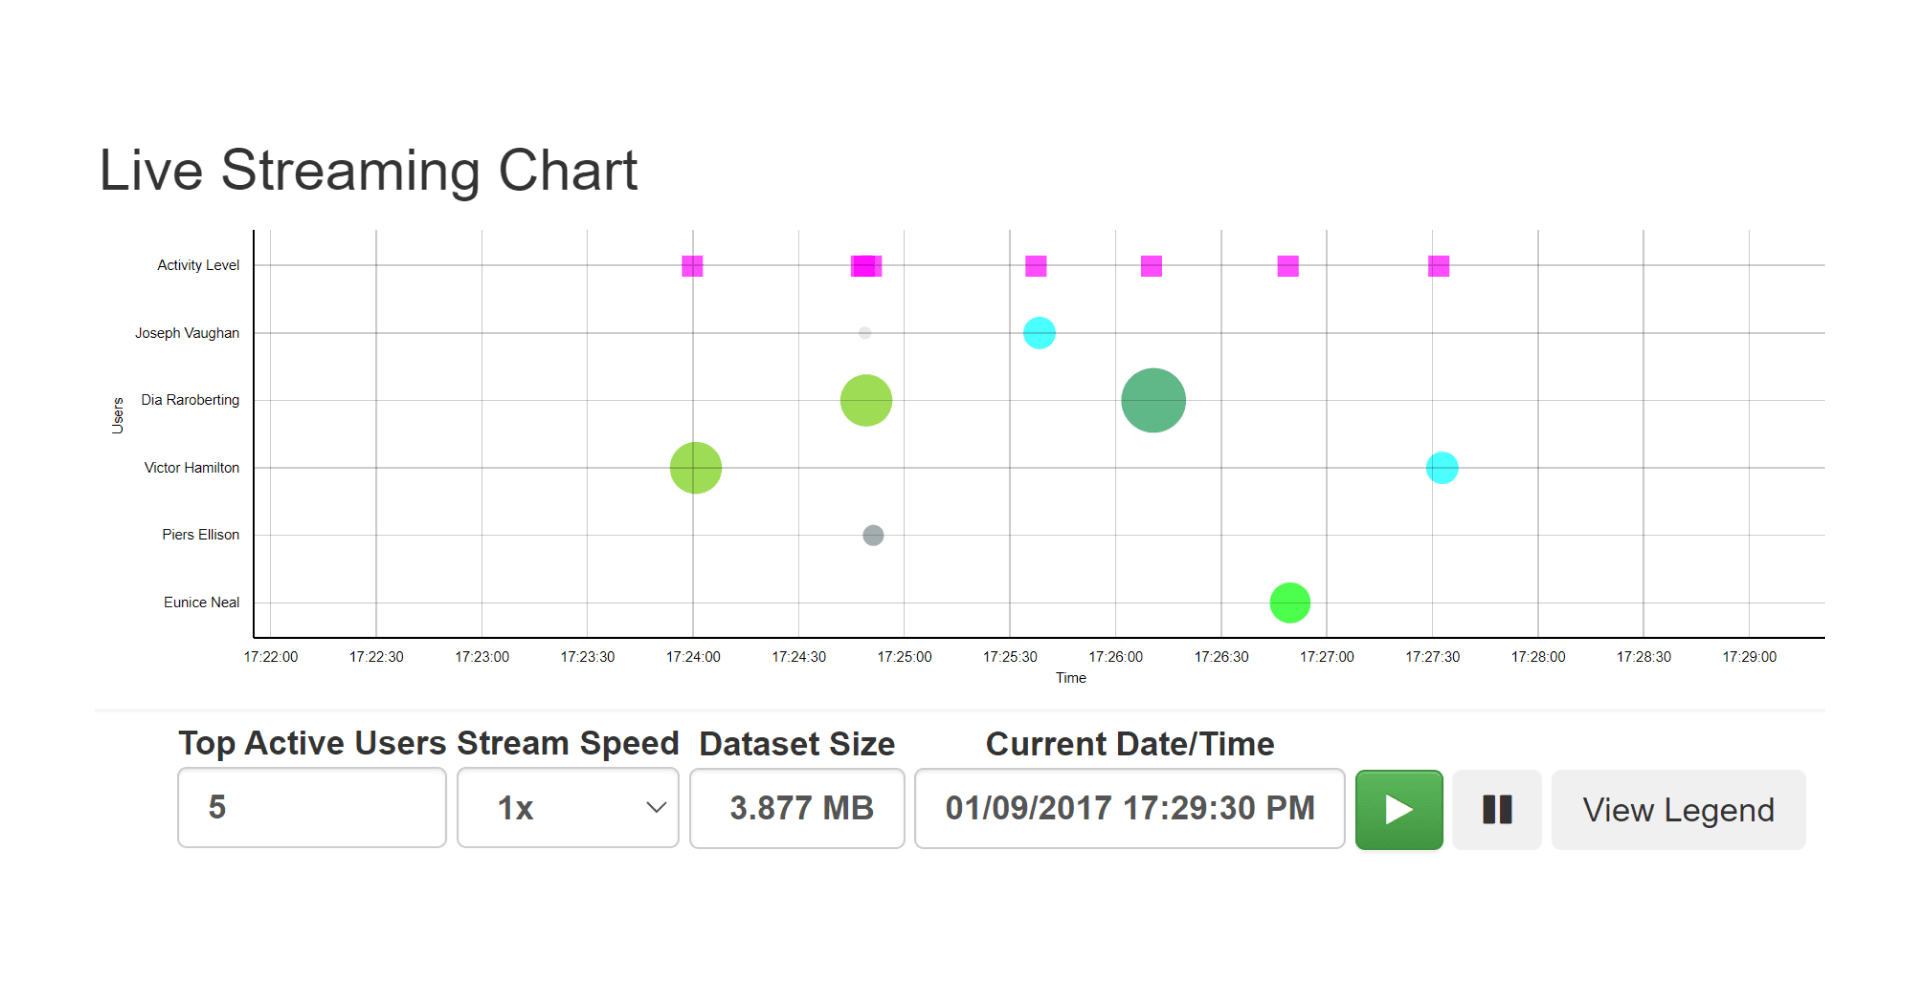
The Activity-Stream-Graph project, developed by Webosmotic, was initiated to meet a healthcare client's unique needs. This endeavor revolved around the creation of a customized D3.js library-based chart, specifically tailored to the healthcare domain. The primary goal was to facilitate the generation of reports and empower the client with an intuitive visualization of doctors' interactions with patients, including the frequency of these engagements. Moreover, the project encompassed additional reports pertinent to the healthcare industry.
Services
Frontend Development
While developing the Activity-Stream-Graph project, several challenges were encountered:
Timeline Visualization: Creating an effective and visually appealing timeline representation of data required careful design and data mapping to ensure clarity and accuracy.
User Interaction: Implementing interactive controls and ensuring a seamless user experience while navigating through the timeline presented a challenge.
The project successfully delivered the following outcomes:
Timeline Visualization: The Activity-Stream-Graph project provided a clear and intuitive timeline visualization of the data, allowing users to easily track and analyze events and activities.
Interactive Features: Users could interact with the timeline using controls such as speed adjustment, play, pause, and view switching, enhancing their ability to explore and understand the data.
Our team successfully delivered the project within the recorded time frame. Here’s a sneak peek at the Activity-Stream-Graph:
The Activity-Stream-Graph project served as an effective solution for visualizing data in a timeline format.
Provided valuable insights into chronological events and activities.
Offered user-friendly controls for seamless exploration of data within the timeline.
Despite challenges related to timeline visualization and user interaction, the project successfully addressed and mitigated these issues.
The project met its objectives, delivering a functional and efficient timeline-based graph.