-
Challenges
-
Deliverables
-
Conclusion
-
While implementing the Heat-map project, several challenges were encountered:
D3.js Animation: Incorporating D3.js animations to smoothly transition between different views presented a technical challenge. Ensuring a seamless shift from one view to another while handling a significant amount of data required careful planning and execution.
Handling Large Datasets:Dealing with a substantial dataset within the context of the healthcare industry presented a challenge. Efficiently managing and visualizing data related to doctor-patient interactions required optimizing data processing and rendering.
-
The project was deemed successful, and the following deliverables were achieved:
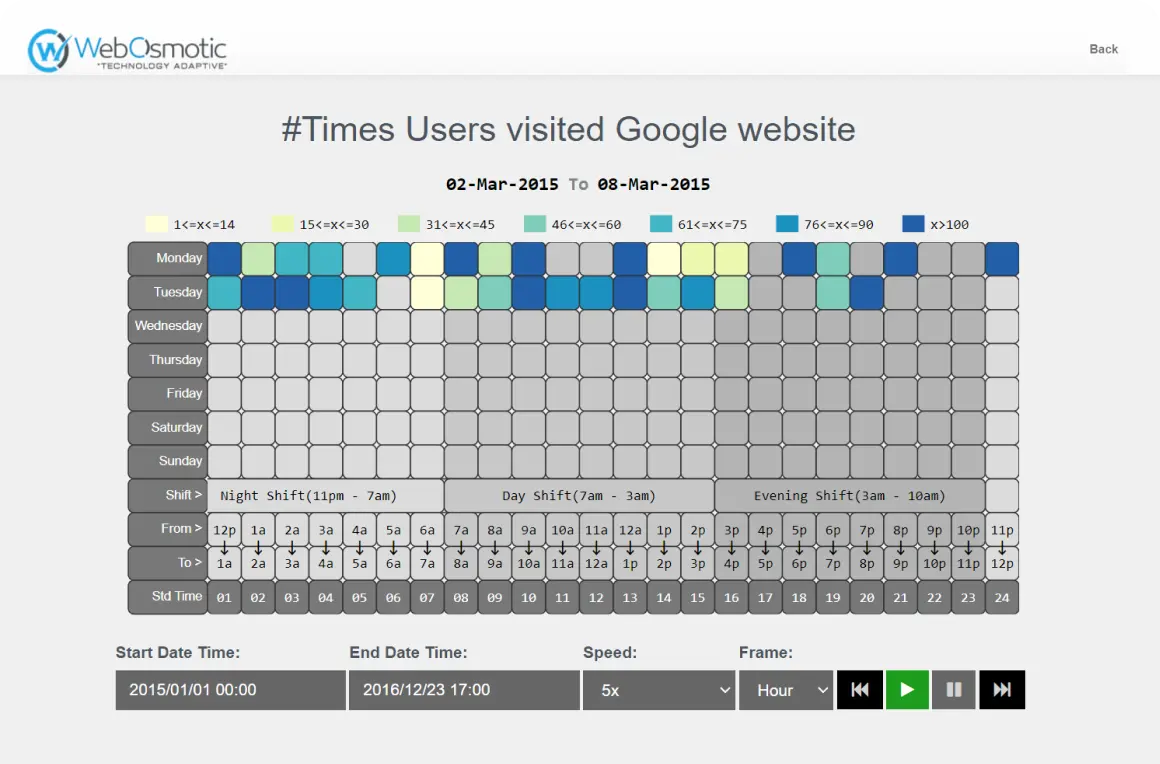
Final Output:The Heat-map project delivered the final output as per the client's requirements. The D3.js-based heatmap effectively visualized data related to patient visits, doctor interactions, and intervals.
Smooth Functionality:The project code was implemented and optimized to ensure smooth and efficient functionality, even when dealing with large datasets.
-
WebOsmotic team successfully delivered the Heat-Map project within the recorded time frame. Here’s how the project concluded:
The Heat-map project delivered a valuable solution tailored to the healthcare industry.
Enabled the client to gain insights into the dynamics of doctor-patient interactions.
Utilized D3.js for effective data visualization, enhancing the analysis of healthcare data.
Successfully addressed challenges related to animation and large datasets.
The project met its objectives, providing a functional and efficient solution for healthcare data analysis.
D3.js Animation: Incorporating D3.js animations to smoothly transition between different views presented a technical challenge. Ensuring a seamless shift from one view to another while handling a significant amount of data required careful planning and execution.
Handling Large Datasets:Dealing with a substantial dataset within the context of the healthcare industry presented a challenge. Efficiently managing and visualizing data related to doctor-patient interactions required optimizing data processing and rendering.
While implementing the Heat-map project, several challenges were encountered:
The project was deemed successful, and the following deliverables were achieved:
Final Output:The Heat-map project delivered the final output as per the client's requirements. The D3.js-based heatmap effectively visualized data related to patient visits, doctor interactions, and intervals.
Smooth Functionality:The project code was implemented and optimized to ensure smooth and efficient functionality, even when dealing with large datasets.
WebOsmotic team successfully delivered the Heat-Map project within the recorded time frame. Here’s how the project concluded:
The Heat-map project delivered a valuable solution tailored to the healthcare industry.
Enabled the client to gain insights into the dynamics of doctor-patient interactions.
Utilized D3.js for effective data visualization, enhancing the analysis of healthcare data.
Successfully addressed challenges related to animation and large datasets.
The project met its objectives, providing a functional and efficient solution for healthcare data analysis.


 View All


