Project Name
Activity-Stream-Graph
Tags
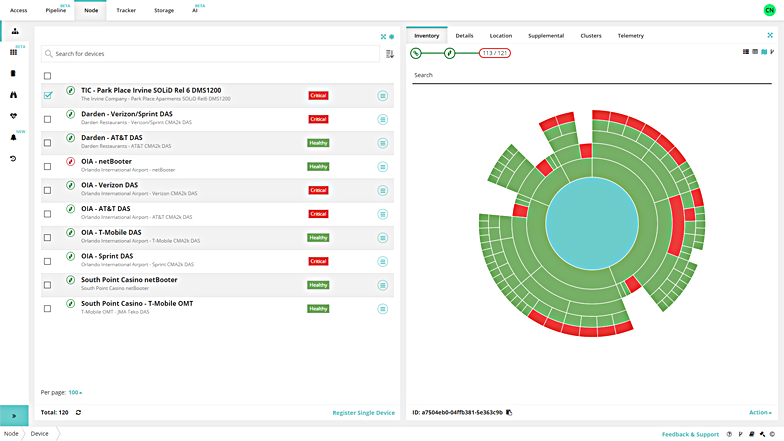
Let's just consider the chart shows managers on y axis which are involved in managing multiple sports activity on particular time shown on x axis at some sports festival. Chart can also tweak the speed of time frame. Chart viewer can also get top 1 to 10 managers according to their activity level.
Technology
- Front end React , Boot Strap , Redux
- Backend Node.js , Express , Mango DB, MySQL , Swagger Doc
- Code Quality Tool ES Lint , Prettier, Husky