Contacts
Get in touch
Close

WebOsmotic develops Activity-Stream-Graph: Empowering Doctors to Visulalise Patient Insights.

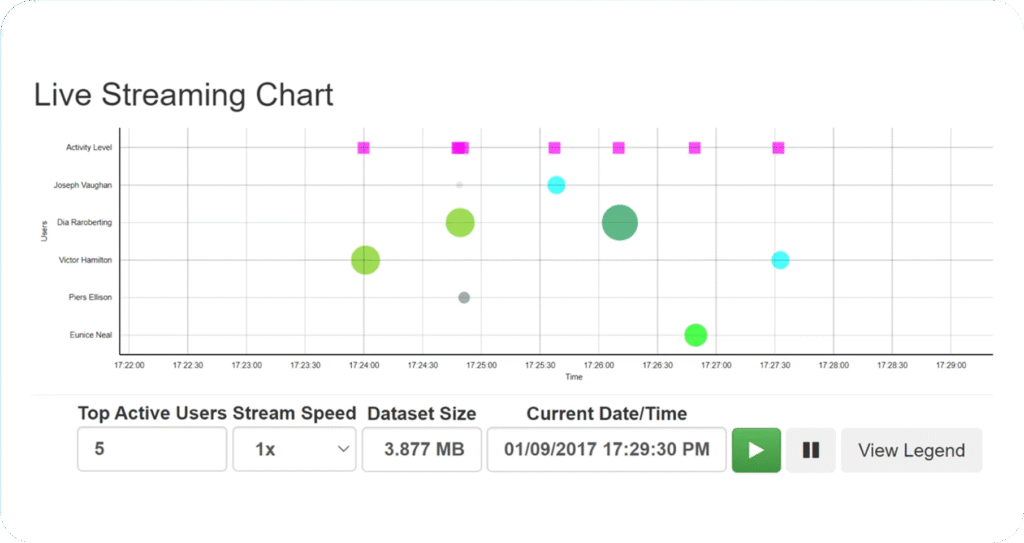
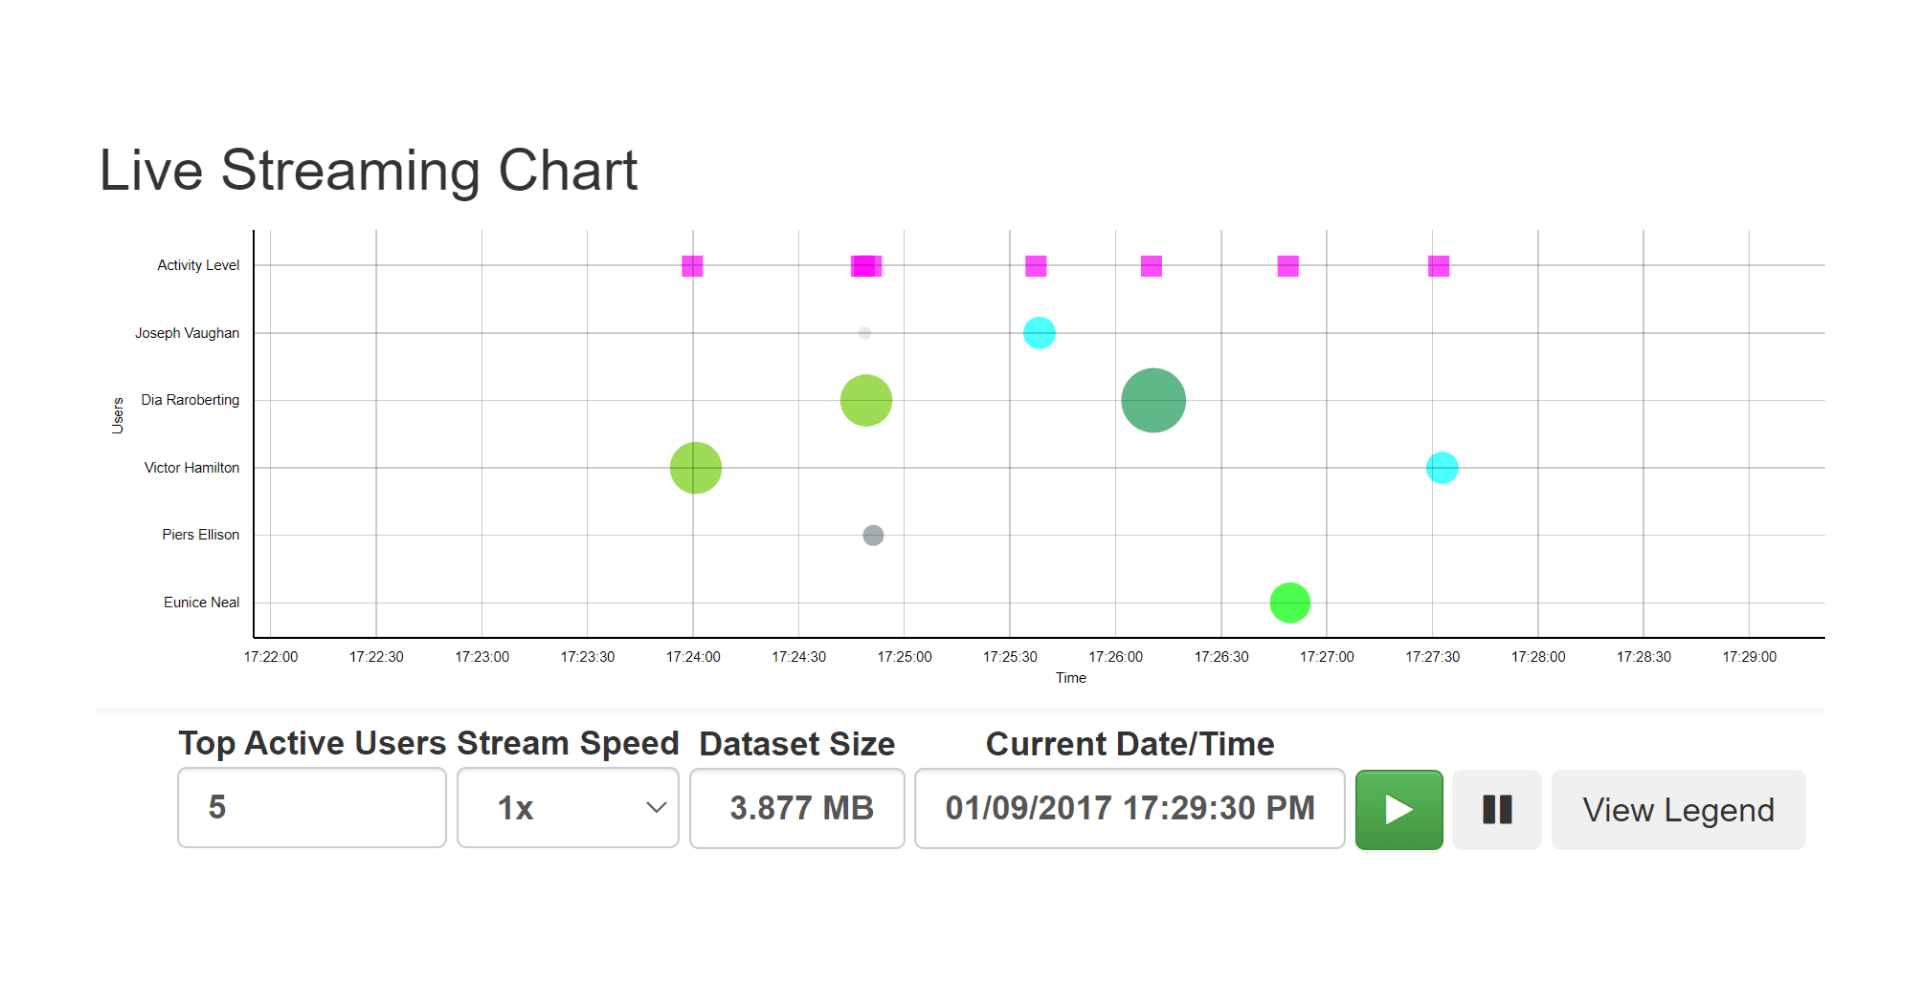
image 230 activity stream graph

Project Summary

The Activity-Stream-Graph project, developed by Webosmotic, was initiated to meet a healthcare client’s unique needs. This endeavor revolved around the creation of a customized D3.js library-based chart, specifically tailored to the healthcare domain. The primary goal was to facilitate the generation of reports and empower the client with an intuitive visualization of doctors’ interactions with patients, including the frequency of these engagements. Moreover, the project encompassed additional reports pertinent to the healthcare industry.

Access

Goals, Final Analysis & Consultation Summary

While developing the Activity-Stream-Graph project, several challenges were encountered:

  • Timeline Visualization: Creating an effective and visually appealing timeline representation of data required careful design and data mapping to ensure clarity and accuracy.
  • User Interaction: Implementing interactive controls and ensuring a seamless user experience while navigating through the timeline presented a challenge.
[ { "@context": "https://schema.org", "@type": "Article", "headline": "Activity Stream Graph - Real-Time Data Visualization Dashboard", "description": "WebOsmotic developed an Activity Stream Graph dashboard for visualizing real-time activity data with flowing, organic streamgraph visualizations that display trends and patterns over time.", "url": "https://webosmotic.com/portfolio/activity-stream-graph/", "image": { "@type": "ImageObject", "url": "https://webosmotic.com/wp-content/uploads/2025/04/activity-stream-graph-Card-Image.png", "width": 408, "height": 230 }, "datePublished": "2024-12-18", "dateModified": "2025-03-17", "inLanguage": "en-US", "author": { "@type": "Organization", "name": "WebOsmotic", "url": "https://webosmotic.com" }, "publisher": { "@type": "Organization", "name": "WebOsmotic", "url": "https://webosmotic.com", "logo": { "@type": "ImageObject", "url": "https://webosmotic.com/wp-content/uploads/2025/04/WO-black-logo.svg" } }, "about": { "@type": "SoftwareApplication", "name": "Activity Stream Graph Dashboard", "applicationCategory": "WebApplication", "operatingSystem": "Web", "description": "A data visualization dashboard featuring activity stream graphs for real-time monitoring of user activities, trends, and patterns with interactive D3.js visualizations.", "creator": { "@type": "Organization", "name": "WebOsmotic", "url": "https://webosmotic.com" } }, "keywords": [ "activity stream graph", "data visualization", "streamgraph", "real-time dashboard", "D3.js", "data analytics", "trends visualization", "activity monitoring", "JavaScript charting", "web application" ] }, { "@context": "https://schema.org", "@type": "BreadcrumbList", "itemListElement": [ { "@type": "ListItem", "position": 1, "name": "Home", "item": "https://webosmotic.com/" }, { "@type": "ListItem", "position": 2, "name": "Portfolio", "item": "https://webosmotic.com/portfolio/" }, { "@type": "ListItem", "position": 3, "name": "Activity Stream Graph", "item": "https://webosmotic.com/portfolio/activity-stream-graph/" } ] }, { "@context": "https://schema.org", "@type": "Organization", "name": "WebOsmotic", "url": "https://webosmotic.com", "logo": "https://webosmotic.com/wp-content/uploads/2025/04/WO-black-logo.svg", "contactPoint": [ { "@type": "ContactPoint", "telephone": "+91-87801-44391", "contactType": "sales", "areaServed": ["IN", "US"], "availableLanguage": "English" } ], "sameAs": [ "https://www.linkedin.com/company/webosmotic/", "https://www.instagram.com/webosmotic_official/", "https://www.facebook.com/webosmotic/", "https://www.youtube.com/@webosmotic" ] } ]

Shall we talk about Upgrading your Business?

Partner with us to implement scalable, real-world AI solutions tailored to your goals.